Climate
Change
Measuring Climate
To fully understand the climate system, we need to know where we were and where we are to figure out where we are going. Even though air temperature and precipitation are the most used indicators of a region's climate, the climate system depends on numerous quantities at different time scales. Generally, there are three different time scales of observation namely past, present and future. This module will provide answers to the following questions:
-
How do we know about the climate in the past?
-
How do we observe today’s climate/ weather?
-
How do we predict the future climate using climate models?
4.1 Past Climate
“The farther backward you can look, the farther forward you are likely to see.” - Winston Churchill. The study of past climate is crucial to understanding how the climate system works and how it relates to the present and future climate. Paleoclimatology is the study of the earth’s climate past records from hundreds to millions of years ago. They use records from physical, chemical and biological materials preserved within the geologic record. Organisms (such as diatoms, forams and coral) are used as climate proxies. Other proxies include ice cores, tree rings, and sediment cores. Chemical proxies include isotope ratios, elemental analyses, biomarkers and biogenic silica.
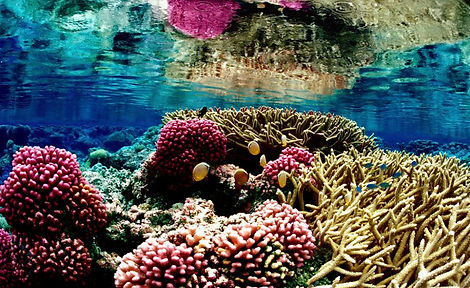
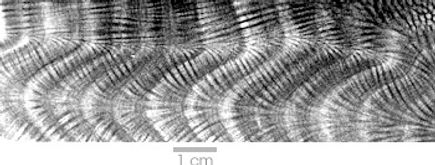
4.1.1. Coral Reefs
Corals build a hard skeleton by extracting CaCO3 from sea water. As corals grow, they deposit this hard skeleton. As the ocean temperature changes, the densities of CaCO3 in the skeletons also change. Corals formed during summer have a different density than winter corals. Using X-rays on the cac03 skeleton slabs reveals periodic light and dark layers (bands) that are the result of seasonal changes in growth. Alternatively, the carbonate contains oxygen isotopes as well as trace metals that can be used to determine seawater temperature in which the coral grew. Warm (cold) seawater evaporates more (less) of lighter isotopes, therefore, skeletons formed during summer (winter) will be enriched in heavier oxygen isotopes. Paleoclimate scientists use temperature recordings to reconstruct the climate when the coral lived.
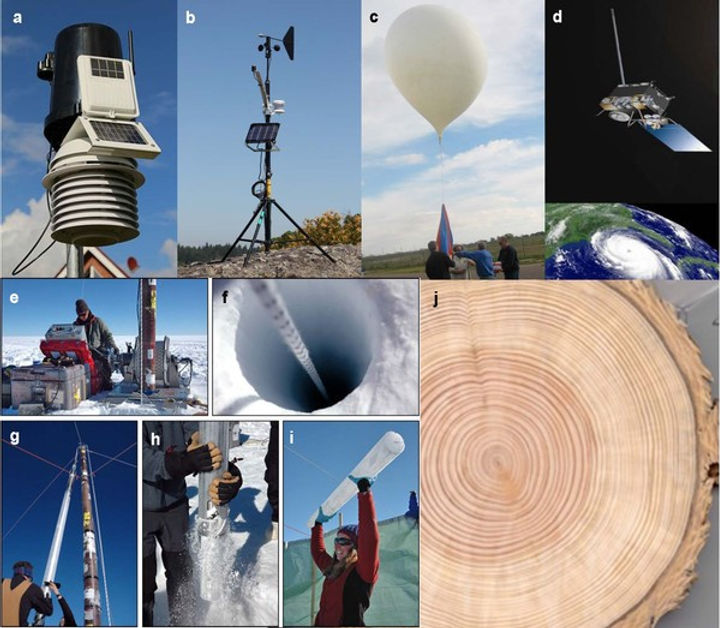
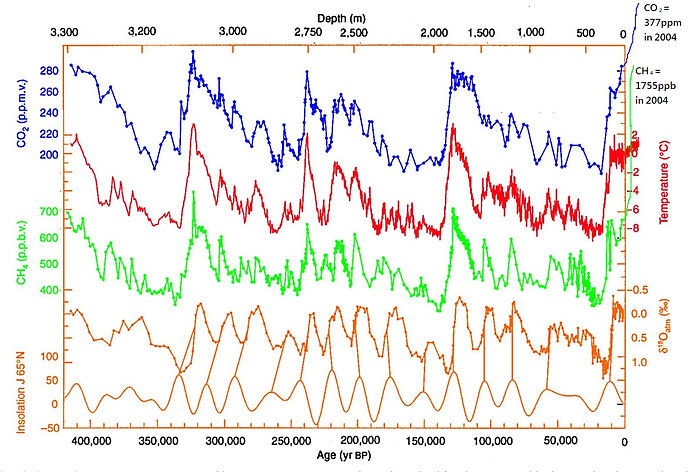
4.1. 2 Ice-core records
Ice cores are cylinders of ice drilled from ice sheets and glaciers. Ice cores provide past records of key climate variables. As snow accumulates, they trap particulates, dissolved chemicals and air bubbles that preserve samples of the atmosphere in that winter season. Therefore, ice-cores layers represent years and seasons, with the youngest ice at the top and the oldest ice at the bottom of the core. Scientists drill down into the ice sheet or glacier and recover ice from ancient times to obtain the previous composition and characteristics of the atmosphere at the time the snow fell or the ice formed in response to different climate conditions. Ice core proxy can be used to determine the regional temperature, precipitation, the atmosphere chemical composition including greenhouse gas concentrations, volcanic activity, and solar activity. For example, apart from Charles David Keeling CO2 observations that began at the South Pole in 1957 and the Mauna Loa Observatory in 1958, ice cores provide high time-resolution atmospheric CO2 data for the prior 1 million years.
Ice core proxy is useful only in regions with ice formation such as high in the mountains and near the poles.

4.1. 3 Sediments from Lakes Beds and Seafloors
Billions of tons of sediments form layers as they slowly accumulate on the floor of lakes, seas, and oceans when washed off by rainfall and river runoff. They provide a vast amount of climate information that spans hundreds of millions of years or more. However, the time resolution that can be inferred from the sediments are typically only on the order of a century. Such sediments include fine grains from distant dust storms, volcanic ashes and organic materials from living creatures. Similar to ring patterns in trees, sediment depositions vary due to seasonal changes in precipitation and river flow rates. For instance, spring runoff contains a greater sediment amount than the rest of the year when flow rates are lower.

4.1. 4 Tree Rings
This is one of the most common paleoclimate proxy records. Depending on the tree species, they can survive in any part of the globe for hundreds of years and sometimes even thousands of years. As they grow over this long period, they experience different local climatic conditions such as wet years, dry years, short dry season, long wet season and more and keep track of this information via their growth layers. Their growth layers appear as concentric rings and each year the tree adds a new ring to its grith. These rings provide information about the age of the tree and yearly weather conditions throughout the tree’s lifespan. A tree ring has two layers; light and dark-colored layers. The light layers grow in spring and early summer, while the dark layers grow in late summer and fall. A combination of one light and dark layer equals one year.
The thickness of the ring reflects fluctuations in temperature and precipitation. During wet, warm years tree rings grow wider than during cold and dry years. For example, in extreme conditions such as drought, the tree might hardly grow and exhibit thinner rings in those years. Scientists use this information to reconstruct past records of temperature and precipitation. Trees also have scars and burn marks that indicate past natural events such as fire.


4.2 Present Climate
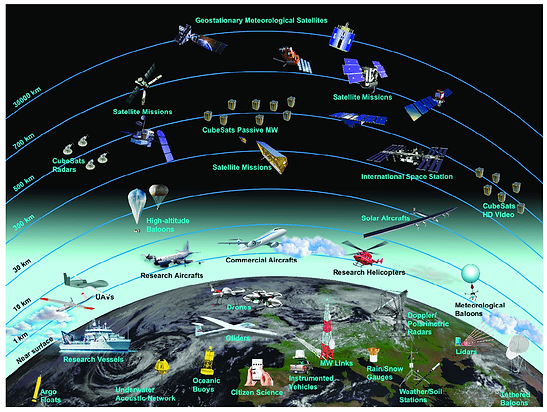
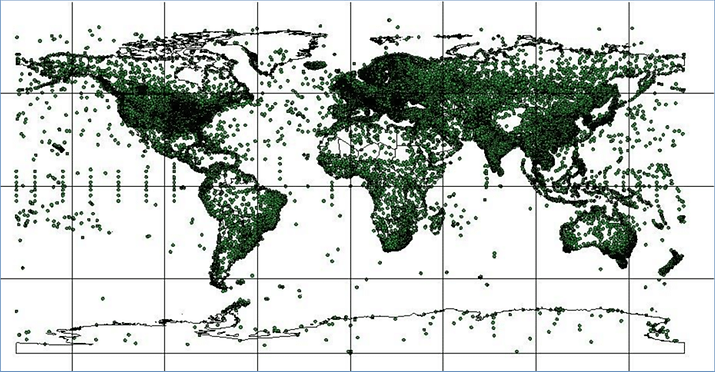
To describe the whole climate system, we need to collect daily observations of the atmosphere, ocean and land-based systems. However, It is very difficult to sample every part ode.g. the deep ocean. Currently, we have over 11,000 weather stations around the globe measuring land, air and sea temperatures, as well as satellites, ships and aircraft that also take measurements. The stations all follow strict standards and 1040 of these stations have been selected to provide high quality climate data to quantify and detect global aspects of climate change. Majority of the weather stations are on land and not evenly distributed globally.
When the focus is on changes within the past 100-150 years, they use data sets derived from observations made by modern scientific instruments. The mercury thermometer and the barometer for temperature and pressure respectively were both invented in the 1700s but were not widely used till much later. In the late 1800s, weather stations were established in the United States. Several parts of the world still lack weather stations.

4.2 Projecting Future Climate
A weather model differs from a climate model. While we want to know about the where and when of a storm or other extreme events in weather models, in a climate model we care about the long term means of weather without too much focus on where or exactly when the weather (e.g. a weather model cares where a hurricane is, and when/where it will impact land, whereas a climate model may only care the average number of hurricanes per year and not about where the details of those storms). However, the climate model is just an extension of the weather model but with a focus on long-term changes rather than 2 weeks. There are other major differences such as spatial/ temporal resolution, boundary conditions, model components etc. Why exactly do we need climate models? There are three major reasons: (1) to better understand climate system behavior, (2) to explore the causes of past climate change, and (3) to make predictions of possible future climate change.
4.3.1 What is a climate model?
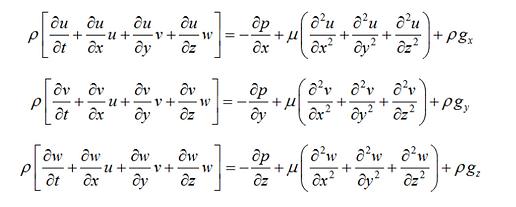
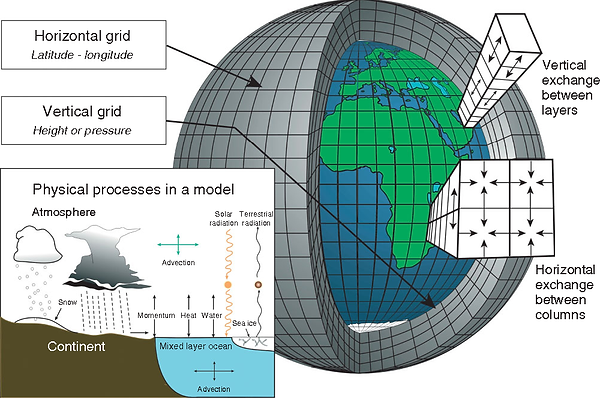
What exactly makes up a climate model? Basically, climate models are made of thousands of lines of code. These codes represent hundreds of mathematical equations used by scientists to describe the complex interactions between many processes in the atmosphere, ocean, cryosphere and land. The Earth’s surface is divided into series of grid cells and the size of a grid cell denotes the model’s spatial resolution. The horizontal grid is based on latitude-longitude while the vertical grid is based on pressure or height. The mathematical equations are solved numerically on each grid cell. The most important and fundamental equations are the Navier-Stokes equations of fluid motion which are use to describe the speed, temperature, pressure and density of air in the atmosphere and water masses in the ocean
Some other equations in climate models are;
-
Clausius-Clapeyron equation which describes the relationship between water vapor and air temperature
-
Stefan-Boltzmann law
Using these equations, an ideal climate model would simulate all of the physical, chemical and biological processes and provide a discrete solution in space(a grid box) and time, which implies that the simulated numerical results represent averages over a grid box (regions) depending on the model spatial and temporal resolution. For example, based on the nature of the study and the pertinent time scales, the model spatial resolution could be high with less than 10km or low with around 100km grid spacing. The time step could be between minutes and years. Recent models now have unstructured grids where high-resolution grids are used in regions of focus and low resolution elsewhere.
The climate system consists of a spectrum of spatial and temporal scales of processes that even the model with the highest resolution (smallest grid size) is unable to resolve small-scale processes such as atmospheric and ocean turbulence in the boundary layer, topography, cloud microphysics and thunderstorms. The higher the model resolution ( the smaller the grid box), the more detailed the simulated climate. Generally, models use parameterization to resolve processes that are smaller than their grid cell. Parameterizations are also used to represent processes with inadequate understanding Parameterizations are functions derived based on empirical or theoretical arguments to reproduce first-order effects of processes not explicitly resolved on large-scale processes. Parameterizations are one of the main sources of uncertainties in global climate models.
There are three groups of climate models based on the level of complexity they resolve:
(1) Energy balance models (EBM)
(2) Intermediate complexity models(ICM)
(3) General circulation models.
The EBM is one of the oldest and simplest models in climate science. It accounts for all the incoming and outgoing energy in and out of the system respectively. It also takes into account the Earth’s albedo or reflectivity. Surface Temperature is the only variable in the model and the word ‘balance’ means no energy is accumulated in the system.
The general circulation models are the most complex and sophisticated models for studying the Earth’s climate. They include almost every detail of the Earth’s system such as carbon cycle, vegetation land types, atmospheric chemistry, deep ocean circulation and glacial. Due to its complexity, it requires a huge amount of computing time depending on its spatial resolution. It requires supercomputers to run
The ICM lies between the general circulation model and EBM. It is more like the general circulation model but with simulations at longer time scales and larger spatial resolution so they are best used for large-scale and low-frequency. The ICM consists of a 3D atmospheric model, a slab (mostly) or a 3D ocean and an energy-moisture balance of the atmosphere. Also, the number of parameterizations is greater in ICM than in general circulation models
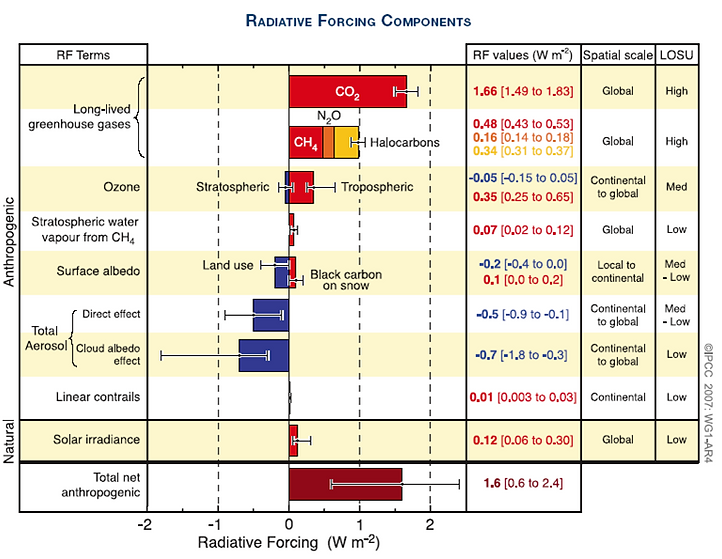
2.3 Why is CO2 Important?
Three characteristics of atmospheric gases determine the strength of their greenhouse effect. The first is their warming potential (ability to absorb and radiate energy) which is the absorption impact of a unit mass on outgoing radiation. The second is the atmospheric lifetime, which is how long they stay in the atmosphere before natural processes remove it. Lastly, the amount of concentration in the atmosphere.
While CO2 has the lowest warming potential, its huge emission (high concentration) through human activities and long atmospheric lifetime make it the highest contributing greenhouse gas to global warming since the industrial revolution. CO2 is the highest contributor of radiative forcing (a net warming influence) since 1750.

According to the IPCC, radiative forcing due to an externally imposed perturbation(say changes in greenhouse gases) is the change in Earth’s energy balance between incoming solar radiation energy and outgoing thermal IR emission energy while all other factors are held constant.